Exploring the state of computer science education amid rapid policy expansion

The role of computers in daily life and the economy grows yearly, and that trend is only expected to continue for the foreseeable future. Those who learn and master computer science (CS) skills are widely expected to enjoy increased employment opportunities and more flexibility in their futures, though the U.S. currently produces too few specialists to meet future employment demands. Thus, providing exposure to CS during compulsory schooling years is believed to be key to maintaining economic growth, increasing employment outcomes for individuals, and reducing historical gaps in participation in technology fields by gender and race. Consequently, providing young people with access to quality CS education is increasingly seen as an urgent priority for public school systems in the U.S. and around the globe.
Primary objectives of CS education, as described in the “K-12 Computer Science Framework”—a guiding document assembled by several CS and STEM education groups in collaboration with school leaders across the country—are to help students “develop as learners, users, and creators of computer science knowledge and artifacts” (p. 10) and to understand the general role of computing in society. CS skills enable individuals to understand how technology works and how best to harness its potential in their personal and professional lives. CS education is distinct from digital literacy as it is primarily concerned with computer design and operations, rather than the simple use of computer software. Common occupations that heavily utilize CS skills include software engineers, data scientists, and computer network managers; however, as described below, CS skills are becoming more integral to many occupations in the economy beyond technology fields.
The past decade has been an active period of policy expansion in CS education across states and growing student engagement in CS courses. Yet, little is known about how policies may have influenced student outcomes. This report offers a first look at the relationship between recent policy changes and participation, as well as pass rates on the Advanced Placement Computer Science (AP CS) exams.
Based on our analysis looking over the last decade, we present five key findings:
- We observe sharp, coinciding increases in both state adoption of CS education policies and overall participation in AP CS exams.
- AP CS participation rates for all student subgroups have also increased, with representation gaps between student groups narrowing.
- Narrowing participation gaps for females and especially Black and Latino students have been primarily driven by the introduction of a new AP CS exam (CS Principles), with gaps changing little since then.
- Passing rates on AP CS exams have modestly increased for underrepresented student groups during this period, resulting in slightly narrower passing gaps.
- AP CS student participation overall is associated with increased CS policy adoption, though participation gaps between over- and underrepresented groups appear to be uncorrelated with recent policy adoptions.
Providing universal access to CS education
CS education is undergoing an important transformation in schools. Classes in computing and CS have long been offered in K-12 public schools, though have not been uniformly required, nor universally available. Thus, access to CS has been uneven across student populations. Yet, the growing importance of technological and computing skills in modern society has compelled many school systems to adopt policies to provide universal access to CS education. Several reasons often motivate this expanded access.
First, expanding CS education is expected to directly benefit students. Individuals who develop expertise in computer and technology fields enjoy higher wages and employment. Even those who do not pursue technical occupations still reap these benefits, as computing and data analysis skills have been broadly integrated into many industries and occupations. Finally, CS education also benefits students who do not use computers in their future careers. Prior studies have documented cognitive and interpersonal skills that CS education uniquely provides to students, which transfer outside of computing domains. Moreover, understanding CS fundamentals contributes valuable life skills that prepare and protect students for a future in which many aspects of daily life are carried out in digital contexts.
“The growing importance of technological and computing skills in modern society has compelled many school systems to adopt policies to provide universal access to computer science education.”
Next, economies overall fare better when individuals are more technologically competent. Studies show a positive relationship between economic growth, technology, and human-capital investments in related skills. Many states and countries view computing and technology jobs as engines of economic growth; thus, providing public school students with quality CS education enables sustainable growth. Federal and local politicians often appeal to this economic rationale to justify investments in CS education to public stakeholders—early CS policy-adopter Arkansas is a prime example.
And third, universal access to high-quality CS education is necessary to close historical gaps in technology fields. Black, Latino, and Indigenous populations and women have long been underrepresented in STEM occupations that heavily rely on CS and computing skills. Given the higher wages and job prospects associated with these fields, this underrepresentation of diverse populations in STEM implicitly contributes to race- and gender-based gaps along economic lines. Developing technical skills provides a path to upward social mobility, as has been shown through the assimilation experience of some immigrant groups: Those with computing and other STEM skills reach earnings parity with native workers far faster than those without these skills.
Prior research indicates low access to CS educational opportunities and resources being critical drivers of STEM participation gaps, which tend to mirror larger socioeconomic inequalities based on race, income, or locale. For example, when the only CS offering in a school is an extracurricular robotics club, only those with intrinsic motivation and the resources to participate will gain access to this learning opportunity. Lower access to CS could manifest in various ways from infrequent exposures to computer-based learning applications in the classroom to fewer courses being offered in high schools. Unequal access fails to explain gender-based participation gaps, though these are likely driven by other socialized gender norms that deter girls from computing and other STEM fields. Universal access, however, is expected to both provide CS skills to all students and stimulate greater engagement among underrepresented groups, increasing diversity in STEM occupations.
“Student access to computer science education is highly variable across the U.S.”
Student access to CS education is highly variable across the U.S. Though many schools have provided computer labs and classes in computer literacy (e.g., typing, internet use, word processing), CS courses go beyond basics to provide instruction on computational thinking and other digital operations, and they require teachers with these skills. In many places across the U.S., CS is only offered to students as elective courses or extracurricular activities, if at all. Leaving the provision of CS education to these voluntary contexts leaves the quality of the CS experience highly variable, and dependent on the availability of local resources. Universal access to CS education, however, is expected to standardize learning standards, augment local resource constraints, and ensure equal access to quality instruction.
Enacting CS education policy laws
Calls for universal CS education have been around for years—ranging from corporate efforts and nonprofit advocacy to federal awareness-raising events—though progress has been slow until very recently. Only since 2015 have these efforts yielded the critical mass to push many states to adopt sweeping change in support of CS education.
To illustrate this transformation, consider the policy changes documented through the annual “State of Computer Science Education” (State of CS) reports, co-authored by Code.org Advocacy Coalition, Computer Science Teachers Association, and Expanding Computing Education Pathways. Since 2017, the State of CS reports have promoted and tracked nine different policies intended to promote CS education in schools.1 The nine policies are:
- whether the state has adopted a formal plan for CS education (abbreviated as State Plan for reporting);
- whether the state has implemented K-12 CS education standards (Standards);
- whether state-level funding is dedicated to CS programs (Funding);
- whether a CS teacher’s certification exists (Certification);
- whether a state-approved pre-service teacher-preparation program for future CS educators is provided at any higher education institutions (Pre-service);
- whether a state-level CS officer exists (State CS);
- whether all high schools are required to offer computer science (Require HS);
- whether a CS course can satisfy a core high school graduation requirement (Count); and,
- whether CS can satisfy a core admissions requirement at state colleges and universities (Higher ed).
In just five years, states showed a remarkable policy transformation; Figure 1 combines and animates this evolution.2 In the 2017 report, Arkansas was the only state that had adopted at least seven of the nine tracked policies. Meanwhile, 36 states had adopted three or fewer policies, including nine states that had adopted no state-level CS policies at all. But in the 2021 report, 24 states had at least seven policies on the books—a remarkable shift observed across all geographical regions. Only 10 states remain in the lowest adoption category, and all states have adopted at least one policy.
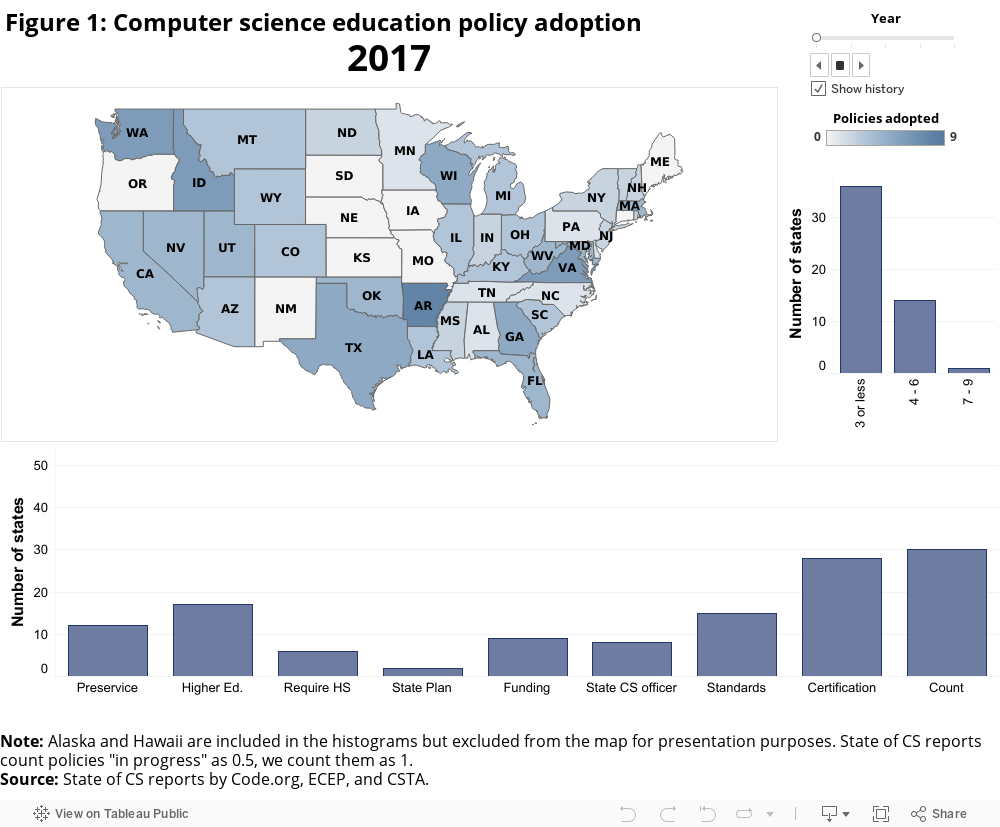
Figure 1 also identifies which policies are adopted. The most commonly adopted policy is having a CS course satisfy a core high school graduation requirement, with all 50 states plus Washington, D.C., adopting it by 2021. Other popular policies include having a state CS plan, funding CS initiatives, creating a state-level CS officer, adopting K-12 CS standards, and recognizing a CS certification for teachers; each of these policy categories counts more than 30 states taking action in the area by 2021.
Providing universal access to CS education in many locales has typically followed the provision of (near) universal access to personal computing devices and broadband. Though some elements of CS fundamentals can be taught without the aid of computers and an internet connection, these are required inputs for a full CS curriculum. Historically, schools and households located in low-income or rural communities have had lower access to digital infrastructure—a phenomenon widely known as the digital divide. Aside from a host of other negative consequences, the implications of this divide on CS education is that students in these contexts have fewer opportunities to regularly interact with computing devices in learning contexts and will have less access to high-quality CS instruction.
More recently, however, the COVID-19 pandemic has acted as a catalyst in making real progress on closing the digital divide. Providing widespread access to needed computing resources has been an urgent priority for many school systems as they have worked to stay connected with students while schools were closed for extended periods. With new devices and ready access to the internet, previously disconnected students are beginning to regularly interact with computers to facilitate their learning. Thus, where some communities may have been less able to offer CS for these reasons in the past, we anticipate that hardware and infrastructure barriers should be less formidable moving forward.
More students are taking AP CS exams
In this active era of CS policy adoption, we explore whether these actions correspond to changes in students’ outcomes in CS. Are students more likely to participate and succeed in CS learning? Do race- and sex-based gaps reduce with more universal access?
To investigate these questions, we use state-level outcomes on the College Board’s AP exams in CS. AP exams are useful outcome measures for this investigation because they are standardized, administered nationally, and represent meaningful competencies in the field that are broadly recognized. This section provides background detail about the AP CS exams.
Situated at the transition point between high school and college, AP courses in multiple subjects are offered in most high schools to advanced students, typically in their final year(s) of high school. Students may opt to take the AP exam at the end of the school year to demonstrate their mastery of the course material. When students matriculate to college, many institutions will award those who passed an AP test with college credits corresponding to an introductory course in the field. Thus, participating in and passing an AP CS exam should probably be considered as a capstone student outcome; that is, one that is realized after multiple years of CS learning opportunities.
Students’ participation in AP courses and exams are widely perceived as important signals of college readiness, and many high schools have expanded their AP course offerings to signal rigor to parents and motivate students. Some scholars question the extent to which participation in AP classes genuinely increases students’ likelihood of college success (since it is primarily advanced students who are enrolling in these courses), and controlling for many student background characteristics sharply diminishes the apparent advantage to AP participation. Other evidence from incentive-driven expansions of AP courses in disadvantaged settings points to AP participation having a causal, positive impact on SAT/ACT scores and college enrollment. Though looking across many studies of the AP program, the academic benefits accrue almost exclusively to those who pass the AP exam (participating in the course without passing the exam provides little, if any, academic benefit).
“Socioeconomically disadvantaged groups lack equal access to AP programming in their schools.”
Even if only those who successfully pass the AP exam benefit, socioeconomically disadvantaged groups lack equal access to AP programming in their schools. In 2014, the Department of Education’s Office for Civil Rights conducted a special data collection on student access to advanced coursework. Reporting shows Black and Latino students account for 27{18fa003f91e59da06650ea58ab756635467abbb80a253ef708fe12b10efb8add} of those enrolled in at least one AP course and 18{18fa003f91e59da06650ea58ab756635467abbb80a253ef708fe12b10efb8add} of those passing at least one AP exam, despite these groups accounting for 37{18fa003f91e59da06650ea58ab756635467abbb80a253ef708fe12b10efb8add} of all students. Further, these gaps are not limited to AP courses but are also evident in advanced STEM courses (like algebra II and physics).
During the years of our investigation, the College Board administered two AP exams covering CS content: Computer Science A (AP CS A) and Computer Science Principles (AP CS P). AP CS A is intended to cover material expected of a first-year CS course in college (with a heavy emphasis on coding), while AP CS P is expected to cover a first-year computing course (including more foundational content such as technology’s impacts on society and understanding how algorithms and networks function). Students in both courses will learn to design a computer program, but only students taking AP CS A will develop the algorithms and code needed for implementation. This does not necessarily mean that AP CS A is more effective—though it is more rigorous and would come after AP CS P in a course sequence. A recent College Board report concludes that students who take AP CS P (relative to those not given the chance) are more likely to take AP CS A in later high school years or declare a CS college major. Though not causal, these findings underscore the importance of AP CS P in developing student interest in the field, particularly among underrepresented student groups.
Of the two exams, AP CS A has a longer history, tracing its origins back to 1984. For much of its history, a modest 20,000 or fewer students would take the exam annually, though these numbers have begun to expand in the last decade. The AP CS P exam, however, was introduced in the 2016-17 school year and has quickly surged in popularity. By spring 2018, its second year of administration, student demand for the AP CS P exam (62,868 public school students) had already surpassed demand for AP CS A (51,645 students).

Figure 2 presents the number of exams taken between 2012-2020 (the most recent year with data available). The first half of the series, AP CS A was the only AP CS exam offered and student demand grew modestly year to year. The AP CS P exam quickly dominated once introduced. In 2020, over 150,000 students took one of these AP CS exams, with nearly two-thirds of that demand coming from AP CS P. For reference, participation in AP exams overall has grown from over 950,000 students in 2012 to 1.21 million in 2020 (27{18fa003f91e59da06650ea58ab756635467abbb80a253ef708fe12b10efb8add} growth). The surging interest in AP CS exams has significantly outpaced general increases in the other AP subjects.
A recent comparative study of the two AP CS exams finds important differences between students, skill mastery, and intended occupational fields. Students who take the AP CS A exam frequently take several other AP exams and intend to pursue majors in either CS or other STEM fields once in college. Conversely, students taking the AP CS P exam only reported less interest in pursuing CS or STEM majors and careers, and they expressed lower computing confidence (as expected, given the more foundational material).
Further, students who took only the AP CS P were more diverse than those who took AP CS A, though underrepresentation for Black, Latino, and female students is still apparent in both exams.3 Figure 3 illustrates the differences in diversity between the two AP CS exams. Like the preceding figure, it shows the recent time series of AP test-takers, though instead of numerical counts we are looking at the share of Black and Latino (light blue lines) or female (dark blue lines) test-takers on the y-axis. Black and Latino students constitute between 13-18{18fa003f91e59da06650ea58ab756635467abbb80a253ef708fe12b10efb8add} of AP CS A test-takers for the entire series but represent 28-30{18fa003f91e59da06650ea58ab756635467abbb80a253ef708fe12b10efb8add} of AP CS P test-takers. Similarly, female students grew from 18{18fa003f91e59da06650ea58ab756635467abbb80a253ef708fe12b10efb8add} of AP CS A test-takers in 2012 to 25{18fa003f91e59da06650ea58ab756635467abbb80a253ef708fe12b10efb8add} in 2020; they constituted an even greater share of AP CS P test-takers during the years it was administered (growing from 30{18fa003f91e59da06650ea58ab756635467abbb80a253ef708fe12b10efb8add} in 2017 to 34{18fa003f91e59da06650ea58ab756635467abbb80a253ef708fe12b10efb8add} in 2020).

Throughout the remainder of the report, we combine student results on both AP CS exams and report pooled statistics. We do this primarily for simplicity in reporting, as most outcomes show roughly redundant patterns when analyzed separately by exam; exceptions to this will be noted in the text.
Exploring AP CS outcomes by student race and sex
The AP CS exam results provide two discrete outcomes that we use in the remaining analysis: test-taking and passing. The College Board reports state-level statistics by year and student race and sex for both outcomes, and these will be linked to state policy changes that we described earlier. This section first investigates how the expansion of testing in AP CS evolved through the lens of race and sex representation.
Before proceeding, we should note an important limitation regarding the AP CS exam passing data: When small numbers of students are present in a reported cell, the College Board censors the cell to protect students’ privacy. Cell censoring is common in states with small populations when reporting is broken out by state, year, exam, and race or gender combinations. Consequently, we are constrained in our ability to investigate state policies and their association with passing outcomes by race and sex. We will report some passing rates as pertinent below, though much of the analysis that follows uses test-taking as the primary AP CS outcome.
As discussed previously, increasing racial and gender diversity in CS and related STEM fields is an important motivating factor in adopting universal CS education policies. Have narrowing gaps in AP CS test-taking and passing coincided with the expansion of state-level CS education policies?
Figure 4 illustrates how differences in representation on AP test-taking have evolved in recent years. The figure is comprised of two animated scatterplots that trace the differences in representation between overrepresented groups on the x-axis (males on the left, white and Asian students on the right) and underrepresented groups on the y-axis (females on the left, Black and Latino students on the right). On both axes are the state’s proportion of each student group represented among test-takers (referenced against the state’s population of 12th-grade students).4 Both panels have a 45-degree reference line, marking parity on AP CS test-taking between overrepresented and underrepresented groups. Points falling below this reference line represent test-taking gaps where whites, Asians, and males continue to be overrepresented. A line is also fitted across state observations—points lying on this line share the same relative proportions in the test-taking population between under- and overrepresented groups.
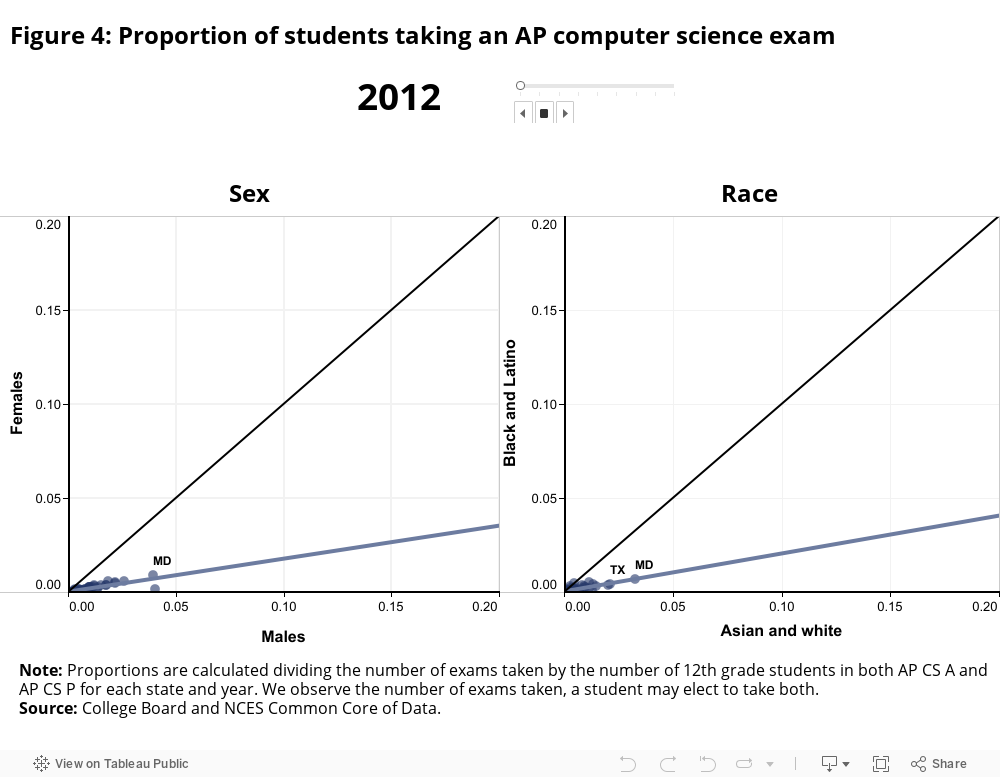
In 2012, the earliest year of the animation, all states are clustered into the bottom left-hand corner of the scatterplots. The position of these points shows low participation overall, and participation is especially low among Black, Latino, and female students. When play is pressed on the animation, the points shift away from the origins, though almost exclusively within the same halves of the plot areas southeast of the reference lines. The fitted line between state observations shows that representation gaps in test-taking have narrowed slightly with time (as the fitted line takes on a steeper slope, moving it closer to parity), though large gaps persist in most states.
Table 1 below provides two key metrics that help to describe how these test-taking patterns by student subgroups have evolved over time. The first metric is the ratio of participation gaps (underrepresented groups/overrepresented groups), which is essentially what the fitted lines in Figure 4 illustrate. A value of 1 represents parity between groups (just as the 45-degree line above has a slope of 1). Participation rates were more than four times higher among male 12th graders compared to females in 2012, resulting in a participation ratio of 0.24. Increasing female participation in recent years has brought them closer to parity with a 2020 value of 0.46. Table 1 also reports the difference in the share of test-takers from overrepresented groups less underrepresented groups, where a value of 0 represents a 50-50 split in test-takers’ demographics. In 2012, AP CS test-takers were just under 20{18fa003f91e59da06650ea58ab756635467abbb80a253ef708fe12b10efb8add} female, and just over 80{18fa003f91e59da06650ea58ab756635467abbb80a253ef708fe12b10efb8add} male, resulting in a test-taking share gap exceeding 62 percentage points. This gap has narrowed to less than 40 percentage points as of 2020. Similar patterns of progress are shown on race-based metrics.

Table 1 shows both the participation ratios and test-taking share gaps calculated by sex and race for three selected years: the first year of data (2012), the year AP CS P was introduced (2017), and the final year (2020). Examining how these metrics have changed over the series is instructive: Much of the overall improvements in the metrics were realized in 2017 with the introduction of the AP CS P exam. Progress made in the years since has been more modest in comparison, and the gains have been larger on sex gaps rather than racial gaps.
We find other encouraging patterns of narrowing gaps when focusing on AP CS passing rates. When rapidly expanding the test-taking pool, one might be concerned that students who are induced to take the AP CS exams will not be as prepared for the exams as those students who had already prepared for AP CS before the expansion. This concern resonates especially for the AP CS P exam, which has expanded dramatically to more than 100,000 exams taken annually in just a few years. To the contrary, though, our analysis of the data suggests that passing rates among underrepresented groups have increased during this period of AP CS expansion and increased faster than those among overrepresented groups.
Figure 5 presents the passing rates on AP CS exams by sex (on the left) and race (on the right) over recent years. The x-axes represent years and the y-axes represent the passing rates for each student group; passing rates are pooled across both AP CS exams. In both panels, the overrepresented groups are passing the exams at higher rates, and an especially large margin is apparent between racial groups. Yet, during these years of participation growth, passing rates among underrepresented groups simultaneously increased. Meanwhile, the passing rates for overrepresented groups (males on the left, whites and Asians on the right) inched upward during this period of expansion. On net, the gaps between these groups narrowed, and female passing rates overtook that of males in 2020.

To confirm that the narrowing gaps depicted in Figure 5 are not simply driven by the surging popularity of the AP CS P exam, we separately investigated passing rates on each of the AP CS exams. The narrowing gaps observed in Figure 5 are also observed in each test. For example, female passing rates on the AP CS A exam increased from 56{18fa003f91e59da06650ea58ab756635467abbb80a253ef708fe12b10efb8add} (2012) to 68{18fa003f91e59da06650ea58ab756635467abbb80a253ef708fe12b10efb8add} (2020), and they increased on the AP CS P exam from 70{18fa003f91e59da06650ea58ab756635467abbb80a253ef708fe12b10efb8add} (2017) to 75{18fa003f91e59da06650ea58ab756635467abbb80a253ef708fe12b10efb8add} (2020). Increases of 5 or more percentage points were similarly observed among Black and Latino test-takers on both tests during this period. Meanwhile, the passing rates among overrepresented groups increased slightly on the AP CS A exam over the period, while dropping slightly on the AP CS P exam. Again, the net results showed narrowing gaps for underrepresented groups both by race and sex on both exams.
Associating CS education policy changes with AP test-taking
Finally, we explore whether states that are making more progress on their CS education policies show more favorable outcomes on AP CS exams. For example, it’s possible that those states taking more policy actions to improve universal access to CS education have seen greater uptakes in AP CS participation or sharper reductions in underrepresented gaps when compared with those states doing little.
Before discussing our results, though, we must acknowledge that policy adoption metrics are imperfect proxies for practice. The State of CS reports are careful to note that state policies vary widely, even within the same policy categories. Further, a state may decide to adopt a given CS education policy, but implementation may be thwarted by barriers that curtail its practical impact. Other states may put CS-enhancing practices into place even in the absence of a formalized state policy. This difficulty can be seen in Figure 6, which represents the differences in observed practices under three different policy-status categories. Figure 6 focuses on the percentage of high schools in a state offering foundational CS courses (y-axis), a practice that provides more universal access to CS for all students. The State of CS policy corresponding to this action is whether states have a policy requiring all high schools to offer CS (Require HS). The x-axis separates those states that have no policy, those that have adopted a policy with a target implementation goal in the future (in progress), and those with the policy already in force (yes).

The box-whisker plots represent the means and distributions of states observed within each of the three policy-status categories. Those states with a state policy in force have the highest mean percentage of high schools offering CS, and those with the policy in progress have higher percentages than states with no policy. Yet, the observed differences in practice across states are far smaller than the policy-status variables alone would indicate. The key point here is that we are constrained to look at the data available to us on policy status, not actual practices; consequently, we may be failing to capture important differences in practice in our analyses.
To conduct the analysis, we merged the State of CS policy adoption data with the AP CS exam data by state and year.5 We ran a series of two-way fixed-effects models, which are intended to net out other correlated changes in test-taking behavior observed within the state over time and across other states contemporaneously. We ran a separate model on each of the nine tracked CS policies and looped this operation across different test-taking metrics as dependent variables. The results of this exercise are presented in Table 2 below.

The columns of Table 2 correspond to different analytical models in which the outcomes of interest are the overall test-taking rate (column 1) as well as the percentage of test-takers that are female (column 2) and Black or Latino (column 3). The nine CS policies are represented down the row headings. The cell corresponding to a row-column combination represents the point estimate and standard error of a two-way fixed-effects model with the policy in the row heading being used as the explanatory variable and the student group in the column heading as the output of interest. Cells are color coded for ease of interpretation to highlight where the estimates are largest.
The high-level summary of the Table 2 results is that several of these CS education policies are positively associated with AP CS test-taking behavior among students overall. The first column shows the largest and most statistically significant estimates correspond to policies that 1) allocate state funding for CS education initiatives, 2) require state colleges to recognize CS courses as STEM courses in admissions decisions, and 3) require all high schools in the state to offer CS courses. We are generally unsurprised at this result, as all three of these policies feasibly have a direct impact on late-high-school students, which are the target population for AP CS exams. Other policies, like offering a teacher certification program in CS education or having a state-level officer responsible for CS education, would likely influence these late-high-school outcomes through more indirect means.
Another finding from Table 2 is that none of the policies seem to be associated with a relative increase in the proportion of test-takers from underrepresented groups. Only one point estimate is significant in column 2 (whether a CS course counts toward a STEM graduation requirement), and it is in the direction of widening the sex-based gap. This result must be taken with a grain of salt because this policy (Count) was primarily adopted in the earlier years of the past decade when gaps were at their largest. A crucial factor driving these estimates is the (almost) constant proportion of underrepresented test-takers between 2018 and 2020, the years for which we have an overlap of policy implementation and AP test-taking data.
We should also note that with the high levels of state policy activity coinciding with a rapid expansion of AP CS test-taking, we cannot claim that any of the point estimates reported in Table 2 represent a causal relationship. Rather, this is our best attempt to isolate associations that are unique to certain policy-outcome combinations to explore the relationship; results are not intended to be definitive evaluations of any given policy.
Even if the expansion of these CS policies had little apparent relationship with test-taking gaps overall, this does not mean that that was the experience of students in all states. We wish to explore whether surges in the performance of underrepresented groups accompanied CS policy expansions in any state, and we do this in the map presented in Figure 7.

Figure 7 presents a bivariate map of the U.S., where states are color coded based on observed changes in two directions: growth in state-level CS education policy adoption and growth in Black and Latino AP CS test-taking rates. States above the median on both dimensions are shaded in dark blue, and states below the median on both are shaded in light gray. The light blue and dark gray shades represent states high on one dimension or the other, but not both.
This analysis reveals some surprising geographical differences. Using the Mississippi River as the dividing line, nearly all states with the highest increases in test-taking among Black and Latino student groups are east of the river (Nevada and Montana are the only exceptions west of the Mississippi). And among the states with the highest test-taking increases in the East, states are split about evenly between high and low policy-adoption categories. Contrast this pattern against states west of the Mississippi, where nearly all states are in the low-growth category for Black and Latino AP CS test-taking, with over two-thirds of those are in the low-growth policy category.
Reflecting on the map leaves us with two important lessons. First, the map vividly illustrates that policy adoption itself is not an accurate predictor of stronger outcomes for underrepresented groups. We observe many states with high policy growth that see comparably little improvement in test-taking outcomes for Black and Latino students; meanwhile, we also see many examples with high growth among Black and Latino students that did not display the same aggressive levels of policy adoption.
“Policy adoption itself is not an accurate predictor of stronger outcomes for underrepresented groups.”
And second, the map suggests that geographical commonalities may be an important lever supporting CS student outcomes. It is unclear from this analysis how those geographical relationships will matter, but this offers some useful direction for future work. A suggestive clue comes from the 2021 State of CS report (p. 14), which shows a policy map of the percentage of schools offering foundational CS, with a similar East-West divide evident. We confirm that the percentage of high schools offering CS at the state level is also positively correlated with both our measure of policy growth and increasing Black and Latino participation. Though merely suggestive, more universal high school CS offerings presents a clear mechanism through which greater shares of underrepresented groups will be exposed to CS instruction, and therefore participate in meaningful coursework leading to AP CS exams.
Concluding discussion and recommendations
We investigated CS education policy adoption and AP CS exam outcomes in recent years—both of which saw rapid expansion during this time. We found gaps modestly narrowing for historically underrepresented student groups in CS and STEM fields, though much of the narrowing was associated with the introduction of the AP CS P exam. Our further investigations made it clear that overall participation rates on AP CS exams appear to be associated with CS policy adoptions, though none of these policies show any clear relationship with increasing the share of historically underrepresented groups among test-takers.
We recognize that some of these findings cut against a dominant narrative in CS education circles, which states that increased access to CS education will lead to narrowing participation gaps. While we do find gaps narrowing in recent years, these do not appear to be related to policy adoption. We clarify, however, that these results are based on a narrow dataset immediately in the wake of policy changes. These findings are not observed over long periods of implementation nor on a broad set of outcomes, which could counter these early patterns. For example, recall from our earlier discussion that white and Asian students are more likely to enroll in a richer set of STEM and AP-level courses generally, and they are more likely to engage in CS courses specifically. It seems probable that, as states kickstart CS education initiatives, the overrepresented student groups that enjoy preferred access may be better positioned to take advantage of newly available opportunities. Similarly, more fundamental outcomes like student exposure to coding or discussions of new technology in class (which contrast with the capstone AP CS outcomes in our data) may be more likely to have a disproportionate impact on underrepresented groups, narrowing formative exposure gaps. In either case, it seems plausible that narrowing CS and STEM participation gaps over a period of several years of policy implementation may still result even if AP CS gaps appear to be uncorrelated with short-term policy changes.
“Even as AP computer science test-taking has increased among underrepresented groups, the passing rate has also increased, resulting in narrower gaps with overrepresented students.”
Our results also provide some unambiguously encouraging news. First, even as AP CS test-taking has increased among underrepresented groups, the passing rate has also increased, resulting in narrower gaps with overrepresented students. Also, even states that have not been as active in promoting CS education policies have still shown large surges in AP CS participation; thus, even in the absence of policy action, we see reason to be optimistic about the trajectory of CS education overall.
We hope these findings invite reflection and re-evaluation of how states are approaching the expansion of CS education. As we close, we offer the following recommendations to state education agencies and policymakers working to expand CS education:
- Track multiple dimensions of CS education. CS is unique among academic disciplines in that it has previously been offered as an elective, but it is becoming more integrated into the academic core curriculum. Consequently, we do not have systematic measures in place tracking student competencies, access to coursework, teacher quality, or other similar outcomes as we do for core academic disciplines. More consistent measurement of inputs and outputs will help to steer states’ actions in CS.
- Prioritize diversity and inclusion in implementing CS policies. The oft-invoked link between expanding universal access to CS education and narrower participation and interest gaps in CS and STEM does have some empirical support, but certainly not enough to conclude that one necessarily leads to the other. Leaders and educators must ensure CS policies are implemented in inclusive ways to increase the chances of narrowing these persistent gaps. We encourage attention to both the classroom experiences of underrepresented student groups and CS educator diversity, too, as race- and gender-based role modeling are important predictors of future interest in CS and STEM.
- Take the long view on CS implementation. This report documents a flurry of activity around CS education in recent years, though we also urge patience and strategy here. Many states are still building the capacity to offer high-quality CS education—perhaps not so much in terms of physical capital (devices and broadband infrastructure), but more so in human capital (building capacity in the teacher workforce and scaling up high-quality instruction). By nature, these investments will take time to mature before students fully realize the benefits. We should not be discouraged by lackluster immediate results.
Computing and technology will be integral parts of the economic and social future awaiting the children of today. Providing access to high-quality CS education will be key in ensuring that all students can meet that future head on.
The authors thank Logan Booker and Marguerite Franco for excellent research assistance, and Nicol Turner Lee, Pat Yongpradit, and Jon Valant for helpful feedback.
The Brookings Institution is a nonprofit organization devoted to independent research and policy solutions. Its mission is to conduct high-quality, independent research and, based on that research, to provide innovative, practical recommendations for policymakers and the public. The conclusions and recommendations of any Brookings publication are solely those of its author(s), and do not reflect the views of the Institution, its management, or its other scholars.
Support for this publication was generously provided by Howmet Aerospace Foundation. The findings, interpretations, and conclusions in this report are not influenced by any donation. Brookings recognizes that the value it provides is in its absolute commitment to quality, independence, and impact. Activities supported by its donors reflect this commitment.